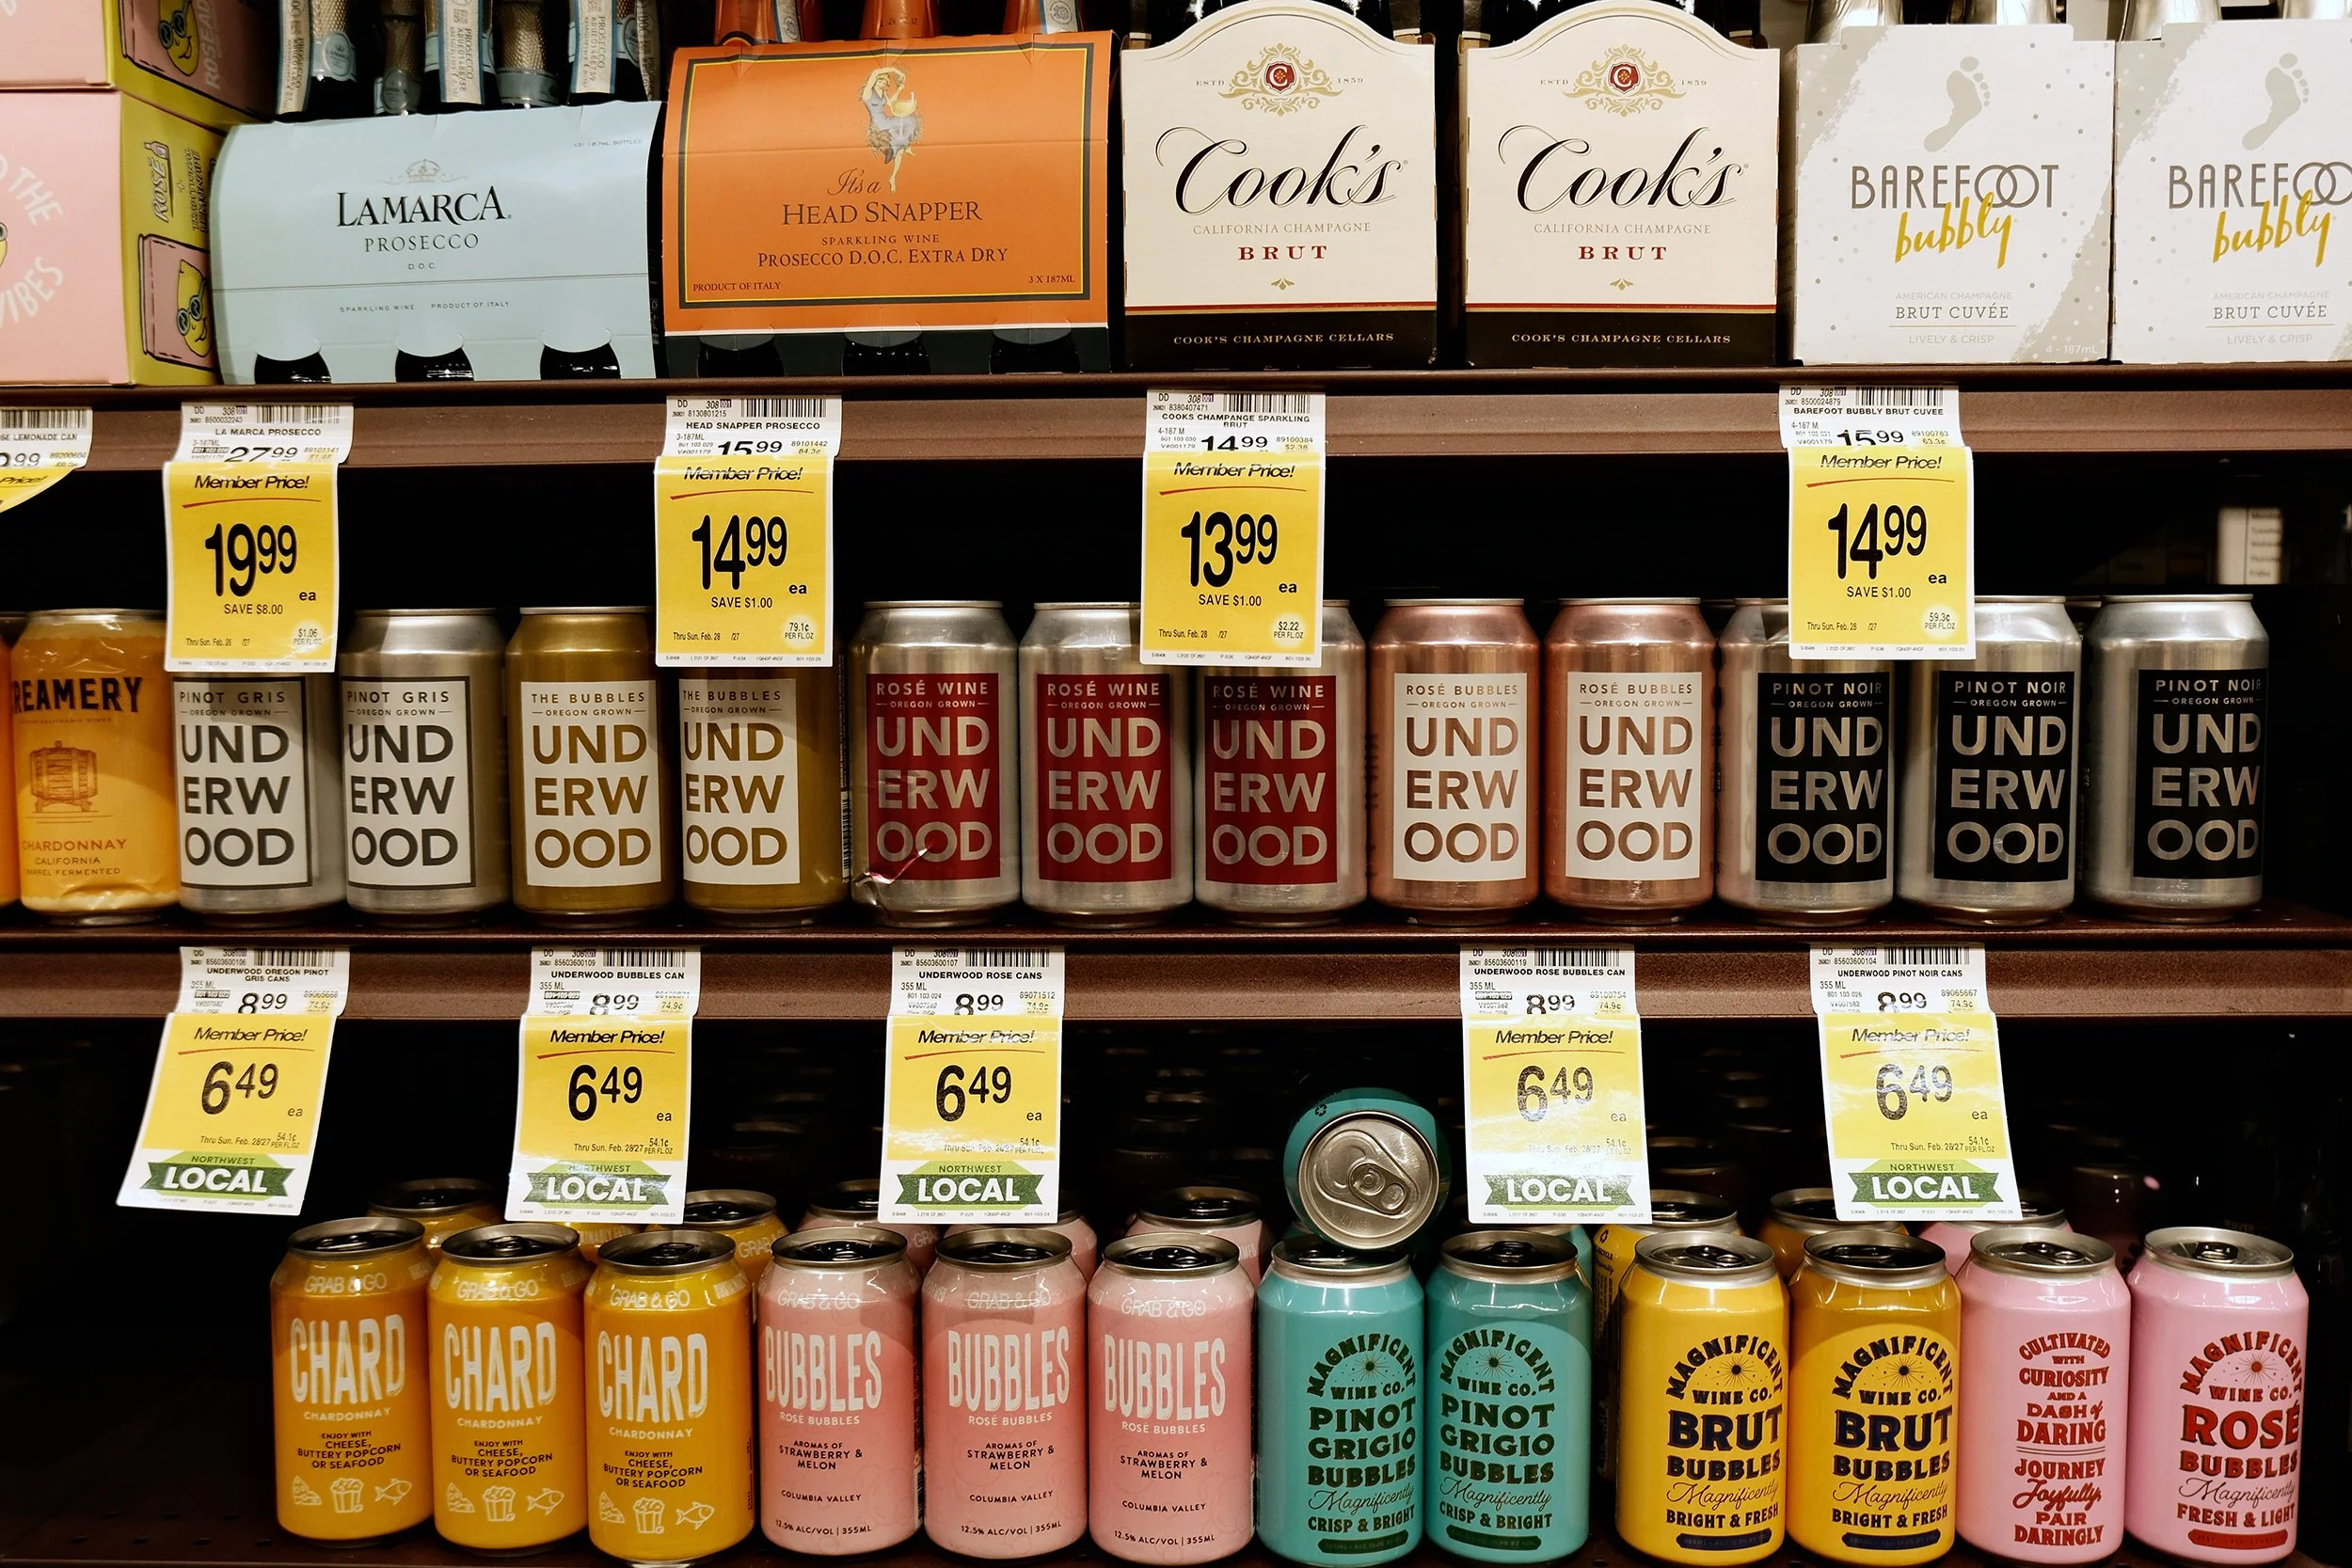
Bringing retail media in house
I took Underwood's sponsored ads back from a distributor partner and ran a test-and-learn program across five platforms. Sponsored-ads return doubled, and I learned where offers actually convert.
ROLE
Associate Marketing Manager, Union Wine Co.
I OWNED
Strategy, setup, budget, creative and reporting
PLATFORMS
2 sponsored-ads channels, 3 offer platforms
TIMELINE
2026, results through September
6,800+
tracked purchases
5x
ROAS on DoorDash, double the prior year
My role
What I did
I built the strategy and the measurement framework, and ran both end to end. I researched the retail media and promotion landscape for beverage alcohol, a category where many platforms can't or won't play. With our national accounts manager, I matched options to where Underwood actually had distribution, so every dollar pointed at shelves our shoppers could reach. Then I took sponsored product ads in house from our distributor partner and owned setup, budget, creative and reporting across every channel.
I ran a lean Instacart test against DoorDash and moved the budget to the channel that returned more. On DoorDash, I set a 2x ROAS floor in automated bidding, then raised spend mid-year once returns held. It delivered 5x ROAS, double the prior year, and matched a full year of prior attributed sales in seven months on half the spend.
5
retail media platforms tested in one year
1M+
ad impressions across the program
One source of truth. Consolidated five platforms' dashboards, ad exports and invoices into a single report, so every channel could be compared on the same terms.
Normalized to cost per purchase. Ads and cashback offers report different metrics, so I compared them on what each tracked purchase cost. The in-app Target offer came in over 30x cheaper per redemption than the cashback app plus paid social.
Full-cost, not platform-reported. Added supporting media spend to every platform's own numbers before judging it. That's what turned a "4.5x" into 0.3x.
How I measured it
Tracked channels with UTMs. Tagged every link, which showed Instagram converting about 3x better than Facebook on the same ad, so budget moved accordingly.
Read the customer mix, not just ROAS. In the prior year's data, cans returned more per dollar while bottles brought twice the share of new-to-brand buyers. That set cans as the efficiency play and bottles as the acquisition play.
Guardrails before scaling. Set a 2x ROAS floor in automated bidding, then raised spend once returns held.
Named the limits. Without retailer sales data, lift can't be proven, so results are reported as attributed and directional.
WHAT I LEARNED